


Every time the stock market stumbles a percentage point or two, headlines invariably scream the same ominous question: Is the big market crash finally here?
It’s easy to sympathise with investor nervousness, despite the S&P500 being less than three per cent from all-time highs. Tensions overseas are triggering spikes in energy prices as strategic reserves are depleted, inflation persists at rates well above central bank preferences, interest rates remain unpredictable, and tech valuations and AI-related spending seem perpetually stretched.
But look beneath the surface of recent market pullbacks, and a different picture emerges.
It helps to understand the mechanics of market volatility, which isn’t about predicting the exact day a dip will happen, but rather recognising the difference between run-of-the-mill turbulence and structural damage.
Dips, corrections, and crashes
It’s worth trying to define market reversals. Doing so may help navigate the market noise:
Remember when energy prices spiked in early 2026 following the commencement of geopolitical conflict in the Middle East? The S&P 500 dropped slightly over four per cent.
Predictably, media headlines relayed panic, yet the market bounced nearly 19 per cent off the lows within months, confirming a ‘pullback’, not a crash. When core economic fundamentals remain intact, or in the absence of systemic fragility, buyers step in to purchase discounted assets.
Market breadth
If you have been reading, you’ll have definitely seen the warnings that the market is a concentrated ‘house of cards’, finely balanced on a knife’s edge thanks to a small handful of mega-cap technology and artificial intelligence giants. Many suggest that if one of those giants stumbles, the entire market risks collapsing.
But we have already seen the SOX index of semiconductor companies fall 24 per cent, while Nvidia and Amazon have declined 16 per cent, Tesla is down 31 per cent, and Meta is down 20 per cent. The Mag 7 leadership has fundamentally shifted, the artificial intelligence (AI) trade is more nuanced and yet the S&P 500 is trading less than 2.5 per cent from its highs.
Clearly, recent market performance shows participation broadening significantly. Gainers now include mid-cap and small-cap companies, defensive sectors, industrial manufacturers, and international emerging markets.
One way to think of market breadth (the various sectors and subsectors) is as architectural support. If a building rests on only two columns, losing one would be catastrophic. If, however, that same building rests on dozens of distributed pillars across various sectors and global regions, it can withstand localised shocks without collapsing.
Corporate earnings
Stock prices eventually follow earnings. The key word, of course, is ‘eventually’. A litany of stocks have collapsed, even as earnings were growing. This tends to happen, however, when individual names are materially overpriced or are included in a thematic or narrative that prices in the future earnings too early.
In the absence of unbridled enthusiasm across all pillars of the market, robust profit growth – highlighted by S&P 500 earnings expanding over 25 per cent in early 2026 – provides a durable cushion against market crashes.
Of course, right now, much of the growth in the U.S. is fueled by massive capital expenditure in technology infrastructure. Optimists hope that as major corporations invest billions into AI hardware, cloud networks, and semiconductor chips, the spending directly generates revenue for a wider ecosystem of suppliers and creates a self-sustaining cycle of economic activity.
Currently, resilient U.S. consumer spending – boosted in part by targeted tax cuts and solid wage growth – allows many companies to continue to generate the cash flow required to justify higher equity prices.
What could trigger the next real pullback?
While a full-scale crash requires systemic breakdown, a 10 per cent ‘correction’ is always possible. Investors might consider two possible catalysts:
The bottom line for long-term investors
Market pullbacks are a feature of a functioning market. As Figure 1., reveals, they are more regular than we’d like to acknowledge. They also clear out speculative excess and create entry points for disciplined capital.
Figure 1. Average intra-year pullback for S&P500 is 14 per cent.
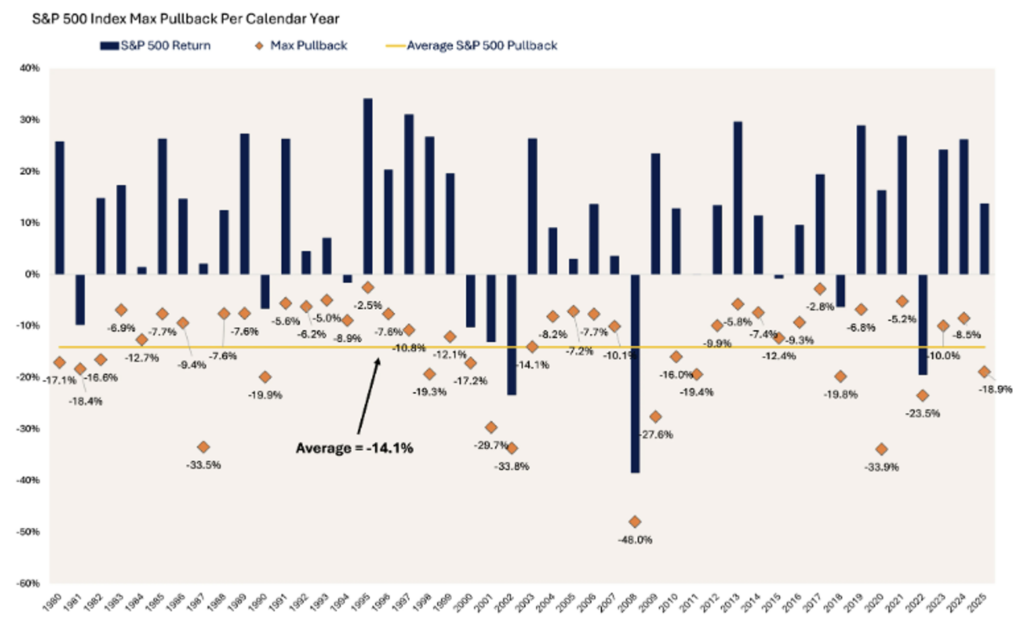
Source: LPL Research, FactSet 11/25/25
After three very good years in equities, it might be wise to diversify some gains, but one mustn’t react to every three per cent headline-triggering dip as an impending catastrophe.
Focus on the structural fundamentals: the absence of recession, systemic financial problems, as well as earnings growth, broad sector participation, and central bank policy. So long as corporate balance sheets and market breadth remain strong, a pullback is usually confirmation to stay the course.