

The highly respected financial services company, Gavekal, recently published its analysis of S&P500 returns during periods of inflation and disinflation (falling inflation) and, by implication, deflation. Its findings are of profound significance for all investors.
To produce their conclusions, Gavekal compared a short-term CPI trend (measured over 12 months) to the long-term CPI trend (over seven years) to define periods when structural inflation is rising or falling.
Periods of ‘inflation’ exist when the short-term inflation trend is above the long-term trend. When the reverse exists, the period is defined as disinflation.
Figure 1. reveals the environment that produces the best (or all of the) returns.
Figure 1. Gavekal Research’s S&P500 return findings
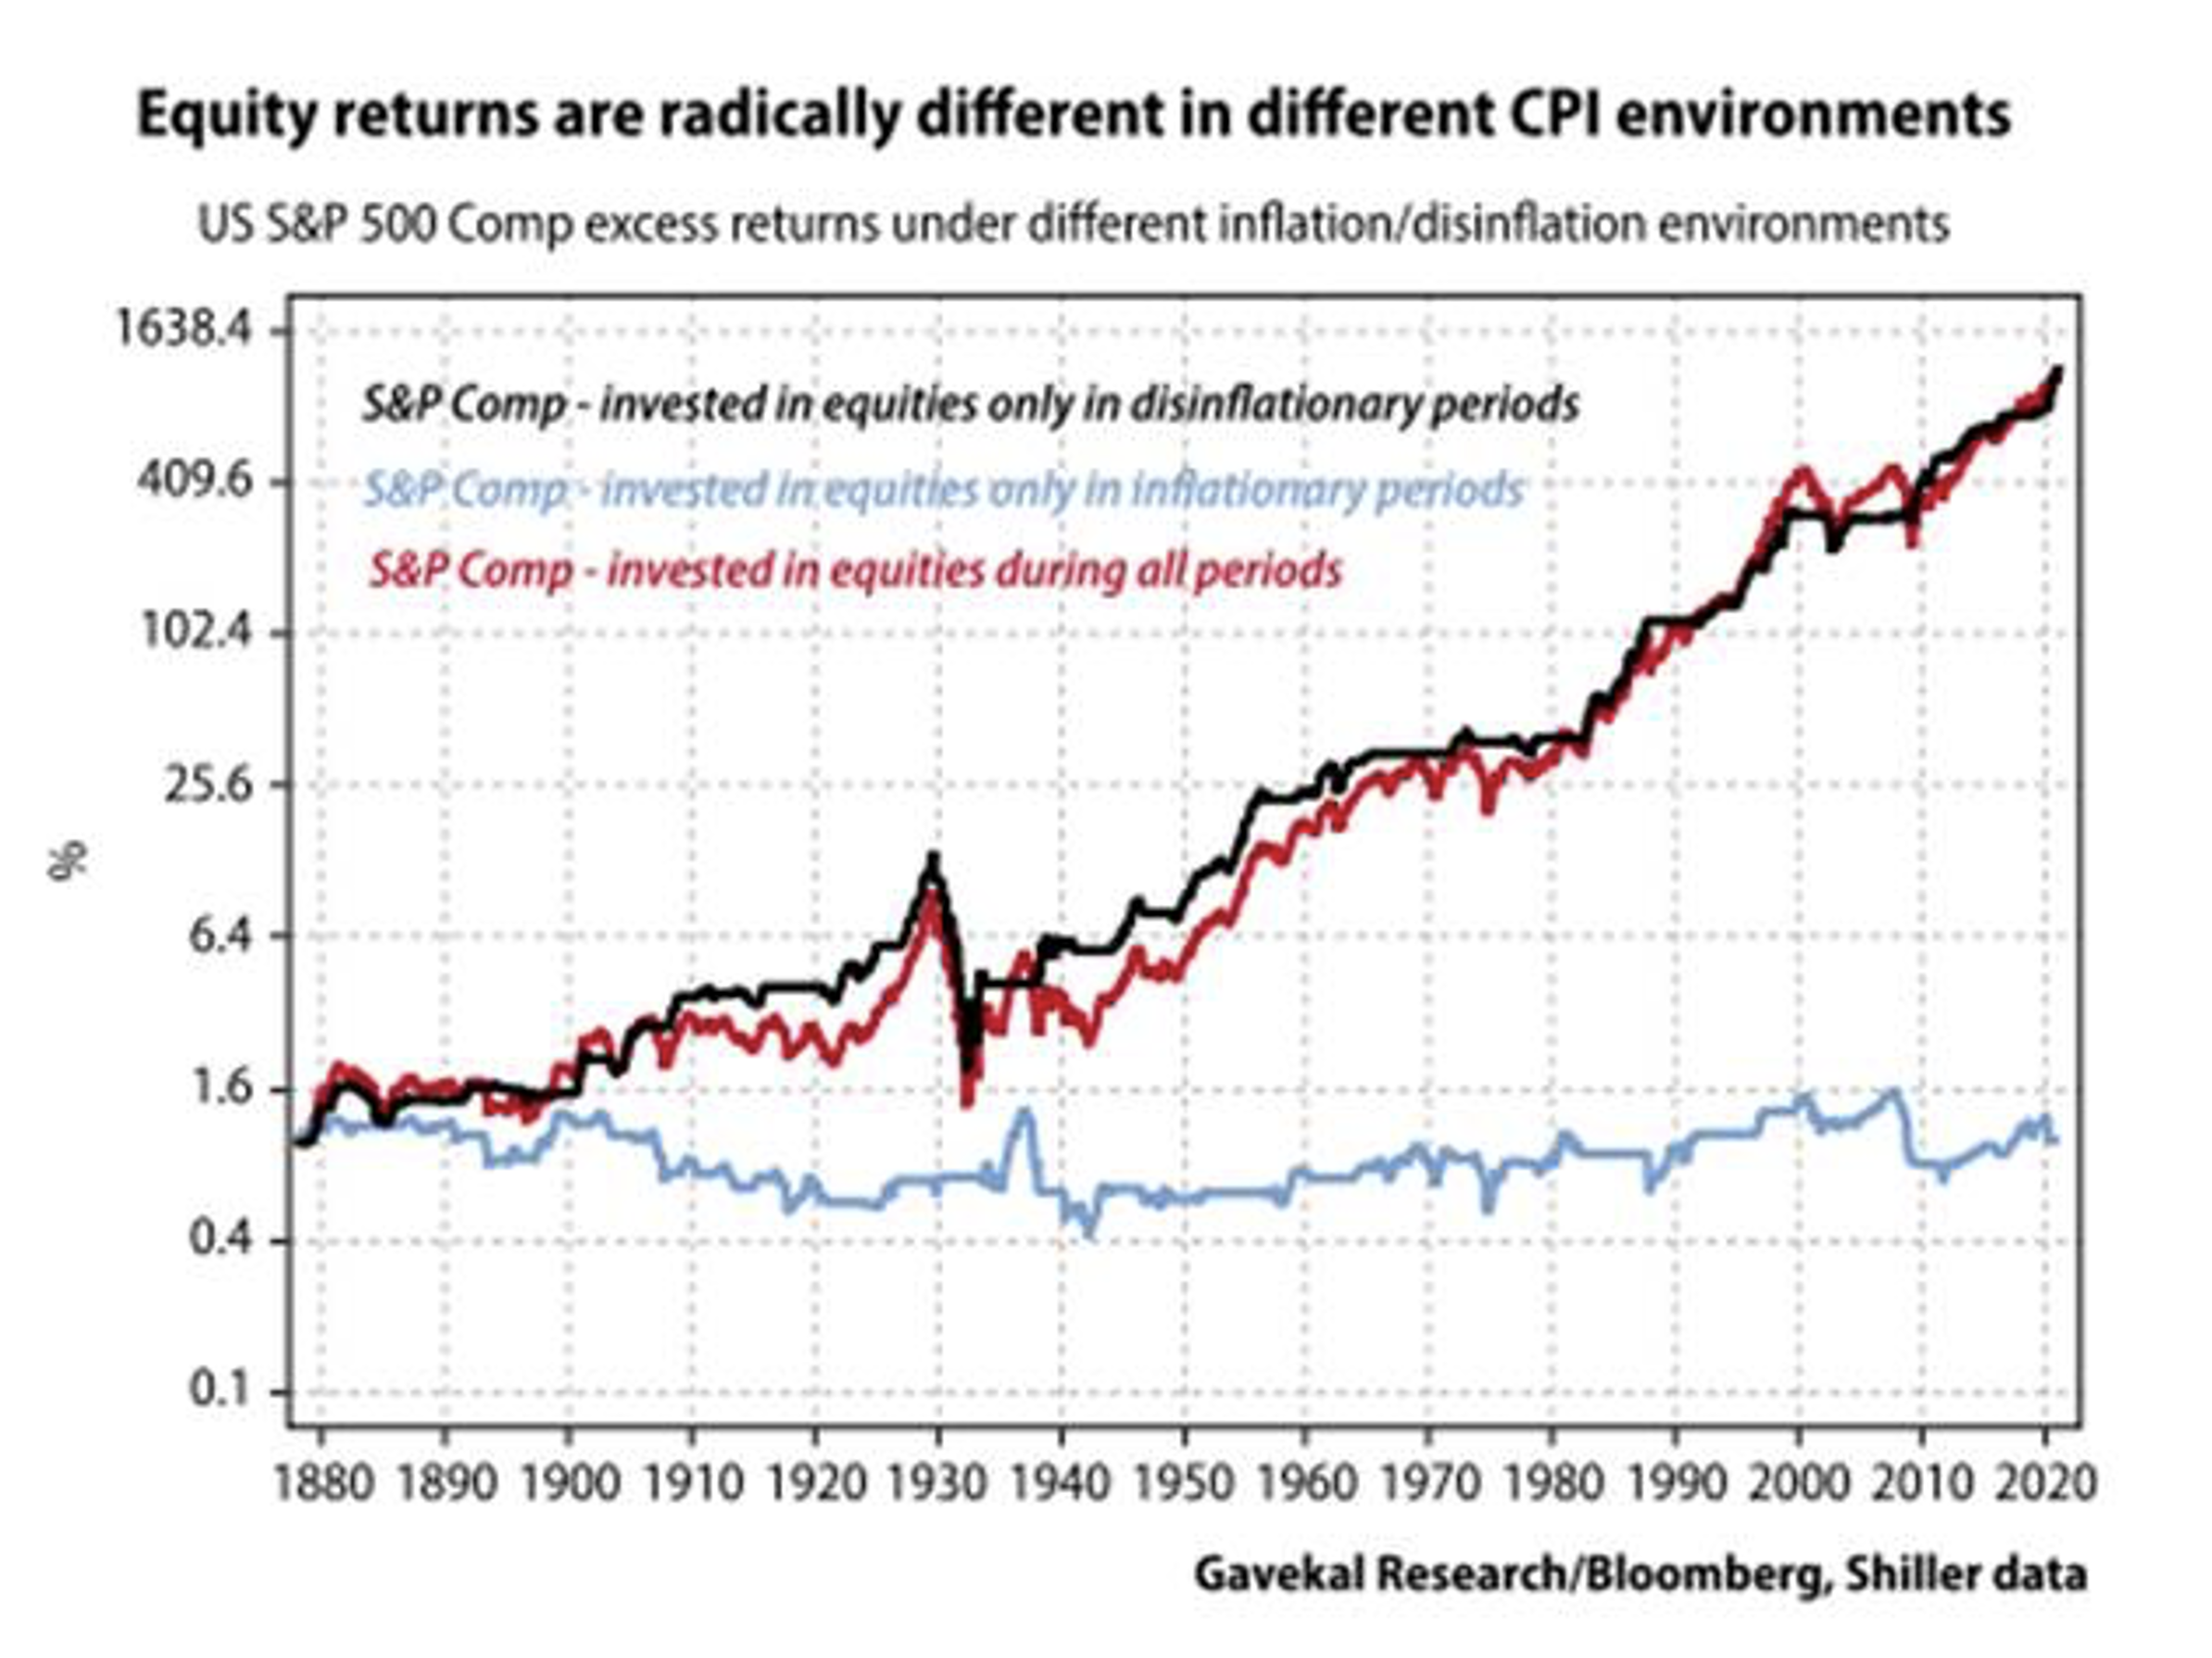
In the 142 years since 1878, the US has spent about half the time experiencing ‘inflation’ and almost the other half disinflationary periods. Outright deflation between 1929 and 1933 made up the remaining period.
What Gavekal Research’s analysis reveals is virtually all of the S&P500’s positive returns since 1978 have been generated during disinflationary periods. By extension, inflation is relatively bad for stocks. You may as well be in cash because the returns are similar, and cash offers much less risk or volatility.
According to Gavekal, inflationary periods are especially challenging for pure ‘growth’ strategies as PE ratios collapsed in “every inflationary period” (see Figure 2.).
Figure 2. Inflation (inverted) and PE ratios
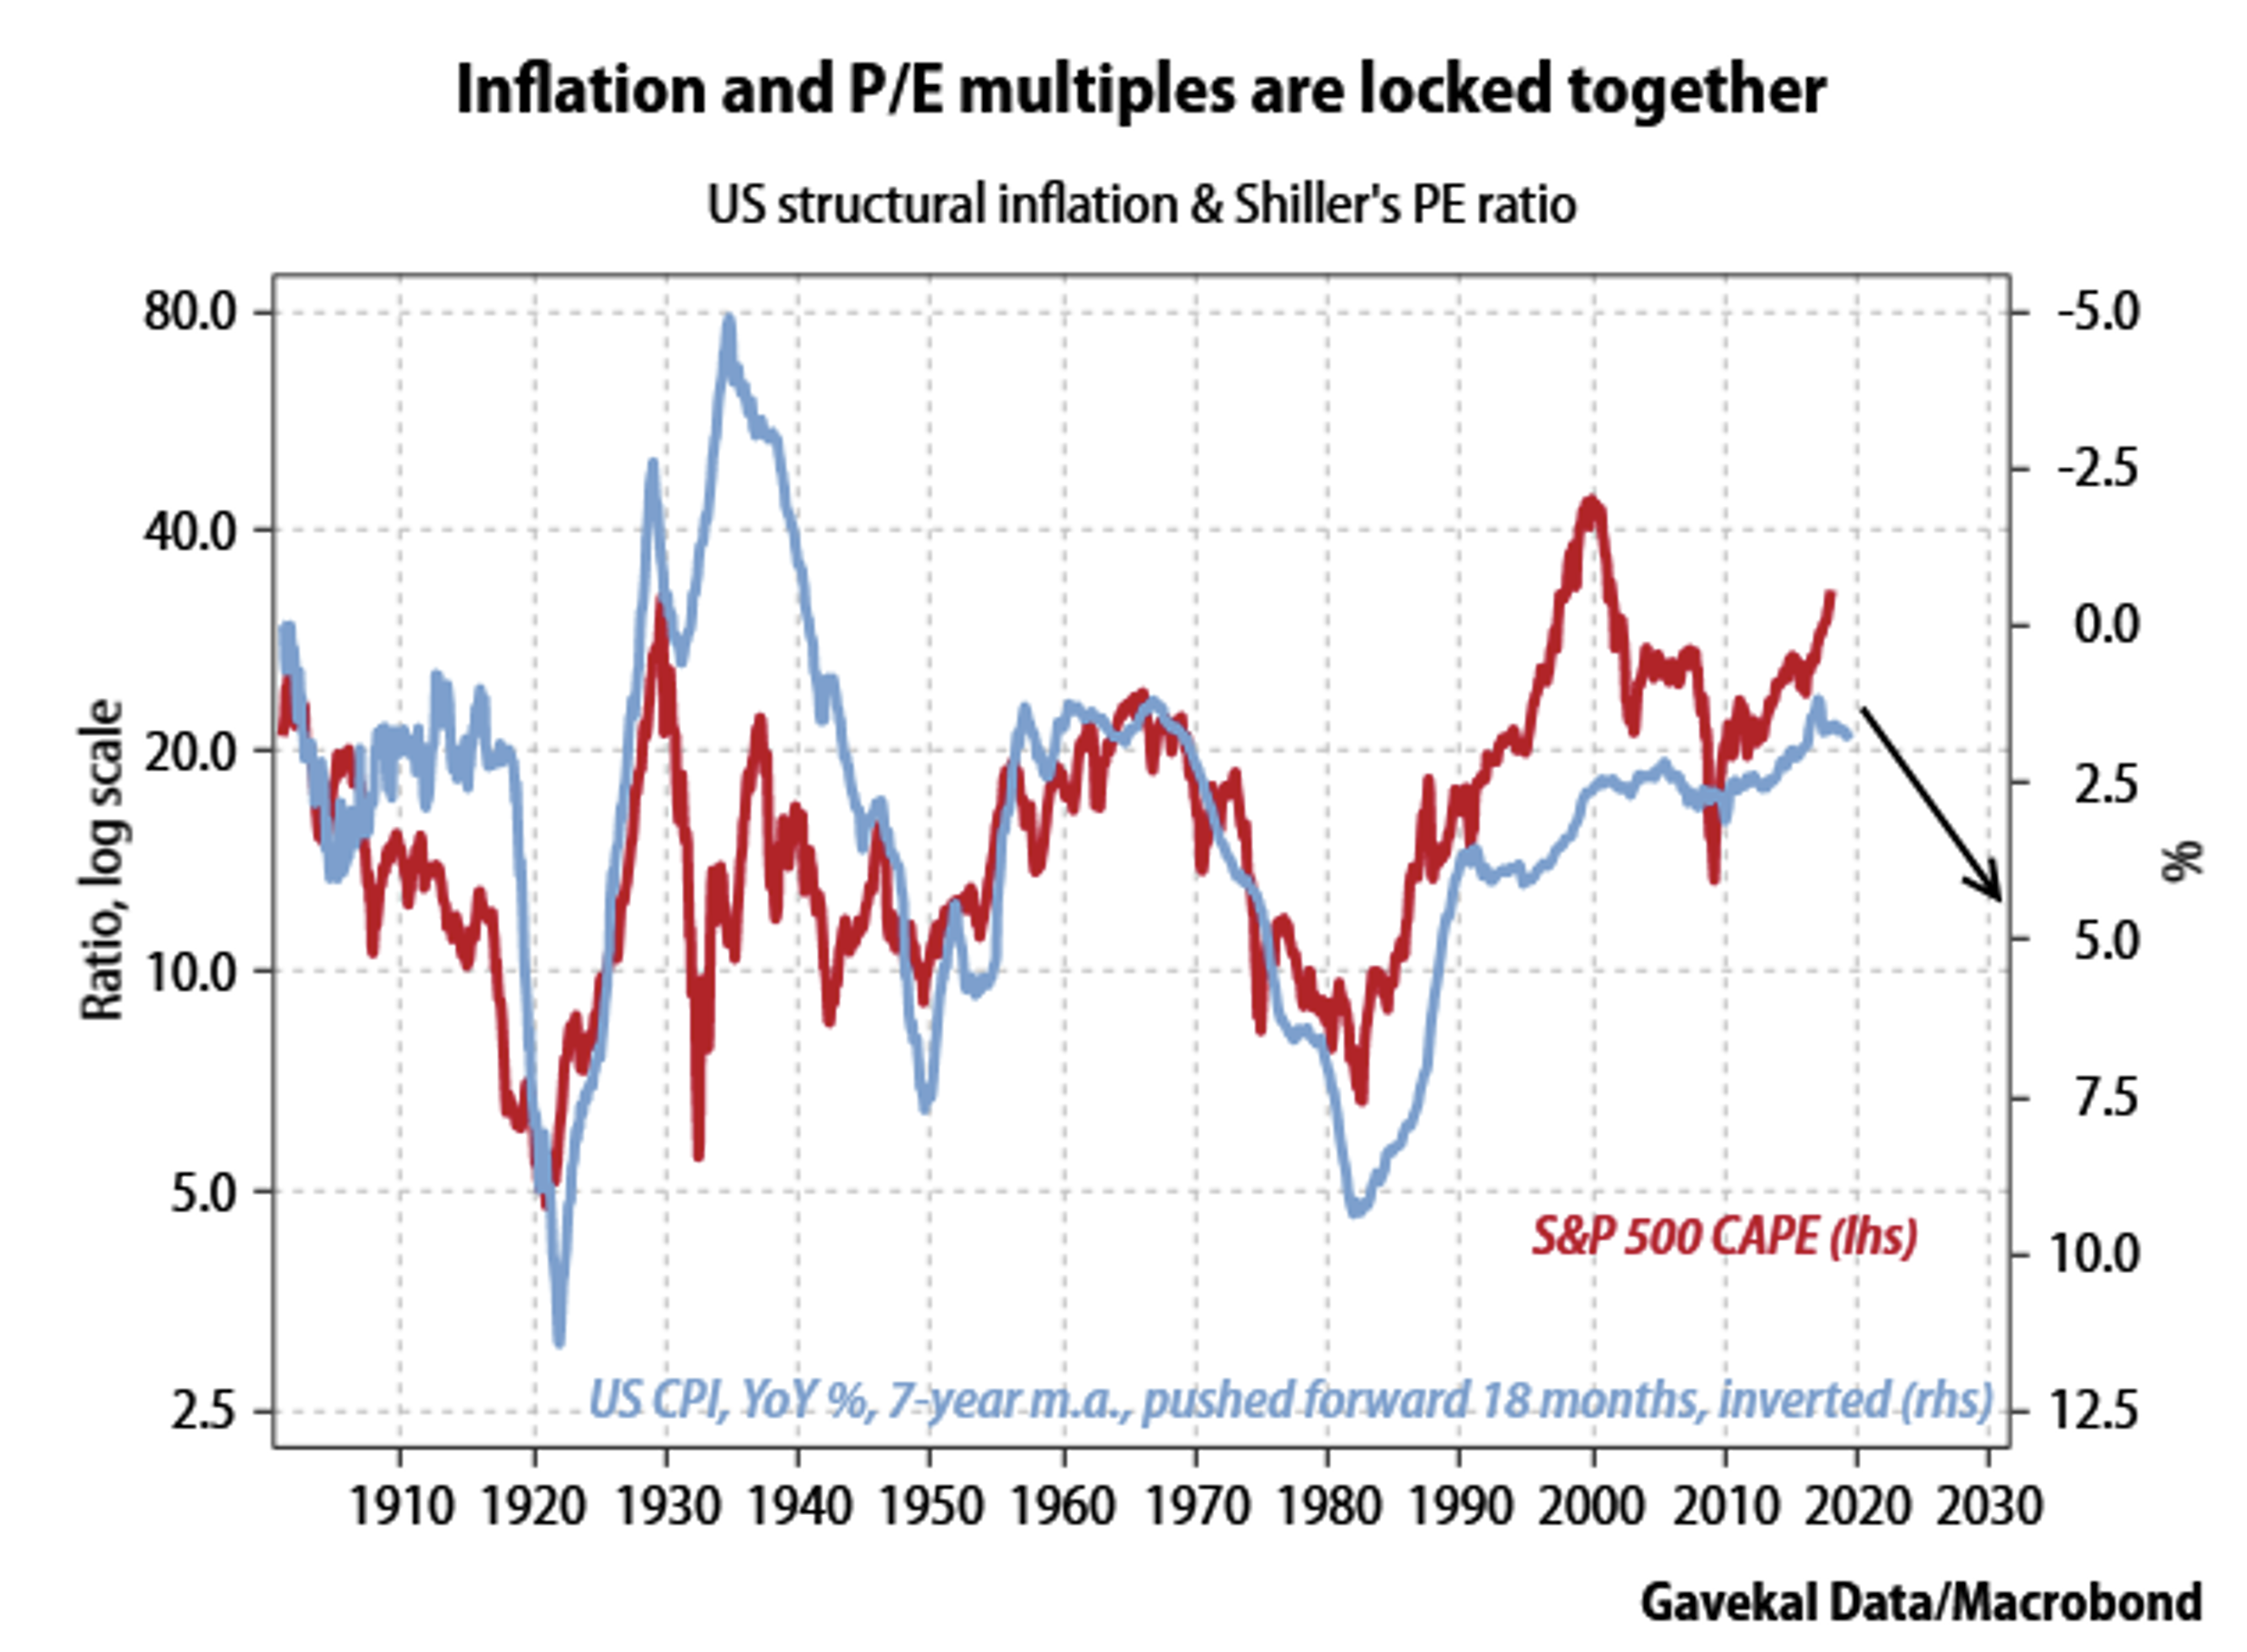
As Figure 2. Illustrates, the inverted Gavekal inflation/disinflation index (“Structural Inflation”) rises and falls in lockstep with PE ratios. If inflation now emerges in the US, the blue line will turn down, and given the extended nature of Robert Shiller’s CAPE Ratio (the second highest since 1870) investors might have cause to be concerned.
Except for the deflationary 1929-33 period noted above, when prices also fell, all of the bear markets took place during periods of structural inflation.
So where does one invest knowing the stock market likes disinflation but detests inflation and deflation?
According to Gavekal, if inflation emerges and persists, Asian currencies, gold, and inflation-linked bonds are the best places to invest. If inflation jumps but then begins to fall (disinflation) the stock market should boom.
In another research note, produced back in 2018, Gavekal also offered Figure 3 and Figure 4 below. Before discussing Figure 4 from 2018, we need to introduce the work of Gavekal founder and its Chairman, Charles Gave from 1978 in Figure 3.
Figure 3. 1978: Where to invest during Booms and Busts, Inflation and Disinflation
We excerpt the 2018 note here: “Back then [1978] the prices of the marbles Louis used to play with at school were rising rapidly and the aim of every economist was to figure out whether the coming year would bring an “inflationary boom” or an “inflationary bust.” Yet the shift that ended up mattering for the next 30 years was not that from the left of the diagram to the right (these shifts tend to occur every five to seven years), but the move from the top of the diagram to the bottom (these seem to occur every 30 to 50 years).”

Figure 4. 2018: Equity performances during Inflationary and Disinflationary Busts, and Inflationary and Disinflationary booms
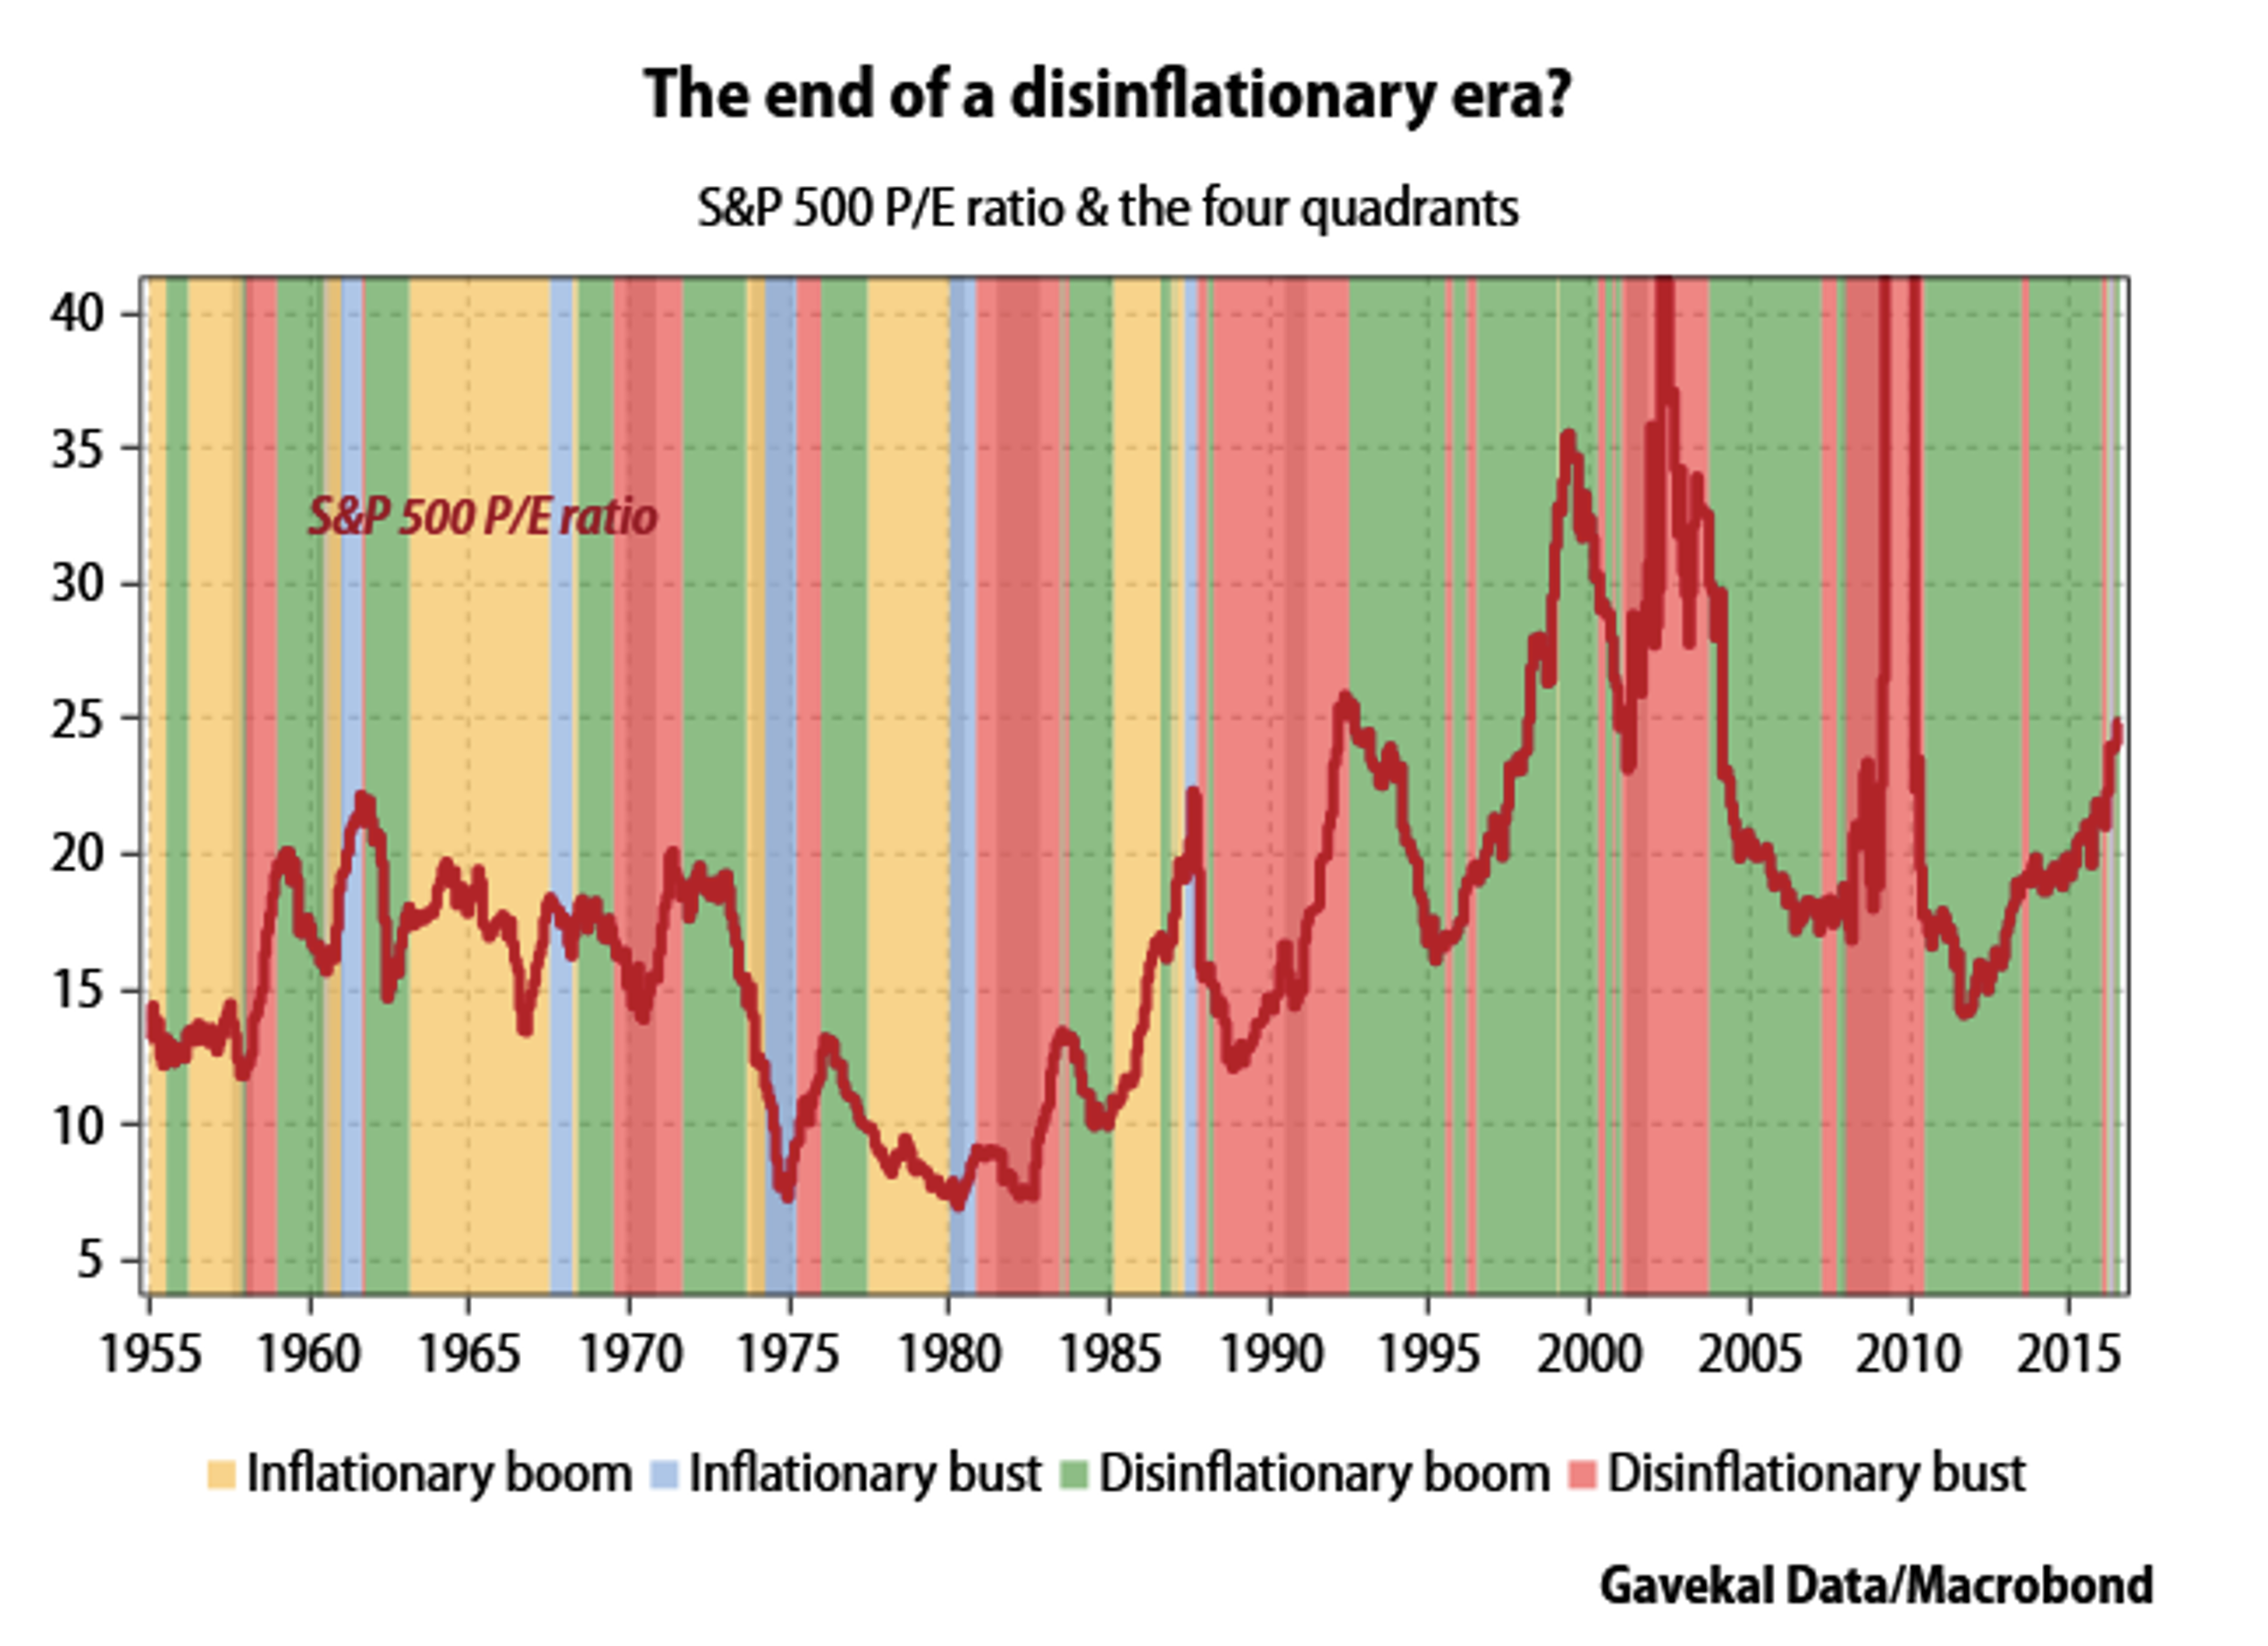
The bust-to-boom shifts from left to right, and inflation-to-deflation from top to bottom, are illustrated against the S&P500’s PE ratio in Figure 4.
Gavekal again from 2018: “The red periods represent “disinflationary busts” or phases of falling growth and falling inflation. These were bad times for equity investors and horrible for commodity investors.
“The green bands represent “disinflationary booms” or periods of rising growth and falling inflation. These were great times for equity investors, especially growth investors, although bonds also did well. In such an environment, the best risk-adjusted returns often came from portfolios half in long-dated bonds and half in aggressive growth stocks.
“The yellow bands represent “inflationary boom” periods, or times of rising growth and inflation. At such times, the best place to be was usually value stocks, commodities and emerging markets.
“The blue bands represent “inflationary bust” periods, or phases of rising inflation and falling growth. At such times, investors should have taken refuge in gold, or in the cash of countries running large current account surpluses and/or large fiscal surpluses.
“As mentioned above, the past 30 years have basically been spent in red and green territory; either disinflationary booms or disinflationary busts. Yet for much of 1960-87 there was rising inflation (yellow and blue in the chart). Hence, a key question for investors is whether the disinflationary boom environment suffers from a collapse in growth (a move from green to red) or a pick-up in inflation (a move from green to yellow).”
So Gavekal’s recent work suggests one only wants to be in equities during disinflationary periods. Figure 3. From 2018, however, shows there are collapses of PEs even during periods of disinflation. One thing that appears to be consistent through the ages though: inflation shrinks PE multiples. And the higher the inflation the greater the pressure on PEs.
A final quote from Gavekal in 2018: “in an inflationary environment, cushioning equity risk with fixed income does not work. Instead, the hedge becomes cash, or gold.”
The only remaining thing to do is work out how to forecast whether we are entering an inflationary boom, and inflationary bust, a disinflationary bust or a disinflationary boom.
On the subject of inflation, economic theory and history suggests substantial increases in money supply are often followed by inflation. However, former Macquarie Banker Nick Moore is more sanguine, noting software and technology has rendered the marginal cost of many things zero. Therefore, rising demand doesn’t feed through to rising inflation as it once did. Moore also noted global supply chain and logistic constraints are short term in nature, while the labour market has plenty of capacity.
We note that when the US unemployment rate was closer to three per cent – before the pandemic – inflation wasn’t a risk. With unemployment at double the pre-pandemic rate, inflation is arguably an even lesser risk today.
What we think however is somewhat irrelevant in the short term. Market participants fear inflation is emerging while growth is also accelerating following COVID-related stimulus. If the market is right, we are entering a yellow Inflationary Boom period. According to Gavekal in 2018, investors want to be in value stocks, commodities and emerging markets. And according to Gavekal’s more recent research, you are better off in cash than the S&P500 (for a similar return and less volatility).
Another possibility however is that current surging growth tapers later this year and next, when we cycle the recent strong growth numbers. Disinflation with slowing growth will equate to Gavekal’s Disinflationary Bust if growth slows significantly or stalls, or a Disinflationary Boom if growth merely settles back to trend rates. The former would mean sell everything, especially commodities, and the latter buy innovative growth companies with pricing power.
We’ll let you decide.
You can find out more about Gavekal research here.