

If you’re needing some encouragement to invest in this anxious market, take a look at historical share returns in the U.S. and Australia. Research going back almost 200 years has found that you have a 71 per cent chance of a positive return in the U.S. in any given year. And your odds are even better in Australia. What’s more, negative years, like we experienced in 2022, are usually followed by a positive one.
In July 2020, New York Life Investments and the Visual Capitalist published an updated look at S&P500 annual returns going back almost 200 years to 1825. New York Stock Exchange (NYSE) data was used for the years 1825 to 1925, and S&P90 data was used for the years 1926 to 1956. In fact, from 1825-1925, the data came from researchers at Yale University and Pennsylvania State University. They collected price and dividend data for almost all stocks listed on the NYSE during its early history. After 1956 S&P500 data was employed. There was insufficient data to include the performance for the 1868 year.
Is the outlook encouraging?
The picture the data paints is indeed an encouraging one. Of the 195 years available, 111 years or 56 per cent of observations, produced returns of between zero and 30 per cent. In fact, 70 per cent of years produce positive returns, suggesting, if you invest on January 1 of any year, there’s an almost 71 per cent chance of a positive return.
Updating the data for the three completed years since the final completed 2019 year in the study, an additional two years – 2020 and 2021 – fall into the positive category between +10 and +30 per cent, and 2022 falls into the negative 10 to negative 20 per cent. The odds of a positive year remain at 70.7 per cent.
But more interesting is the pattern of good years following terrible years or periods. Take the extreme case of the great depression-related years of 1929 (-8 per cent), 1930 (-25 per cent), 1931 (-43 per cent) and 1932 (-8 per cent) for example. It’s the only time in the last 200 years the market fell four years in a row. And then in 1933, the market rose 54 per cent, recorded a small one per cent decline in 1934 and then rallied 48 per cent in 1935 and 34 per cent in 1936.
The decline of between 20 and 30 per cent in 1907 was followed by a gain of between 30 to 40 per cent in 1908. The decline of 35 per cent in 1937 was followed by a 31 per cent gain in 1938. The 11 per cent decline in 1957 was followed by a 43 per cent gain in 1958. A negative return of 15 per cent in 1973 and a 27 per cent decline the year after, were followed by a 37 per cent gain and a 24 per cent gain in 1975 and 1976 respectively. A fall of 22 per cent in 2002 was followed by a 29 per cent gain in 2003, while a 26 per cent gain in 2009 followed the 37 per cent decline in 2008.
Years where large falls occurred, were more often than not followed by equally meaningful positive reversals the year after. And consecutive negative years were more often followed by consecutive positive years.
That should encourage investors in 2023 and 2024. With the exception of a deep recession, and if history is anything to go by, the negative return of circa 19 per cent for 2022 is more likely to be an isolated event (consecutive negative years are rarer than isolated negative years) and is more likely to be followed by a solid positive year. And if 2023 proves to be another negative year, the odds of 2024 and 2025 being positive rise.
Of course, each historical observation is a mutually exclusive event, meaning there is no reason the patterns of the past should be repeated. Nevertheless, investors might take some encouragement from the wealth creation tendencies of the underlying businesses and that ultimately as businesses become intrinsically more valuable, their share prices should eventually follow.
Figure 1. S&P500 annual Return histogram
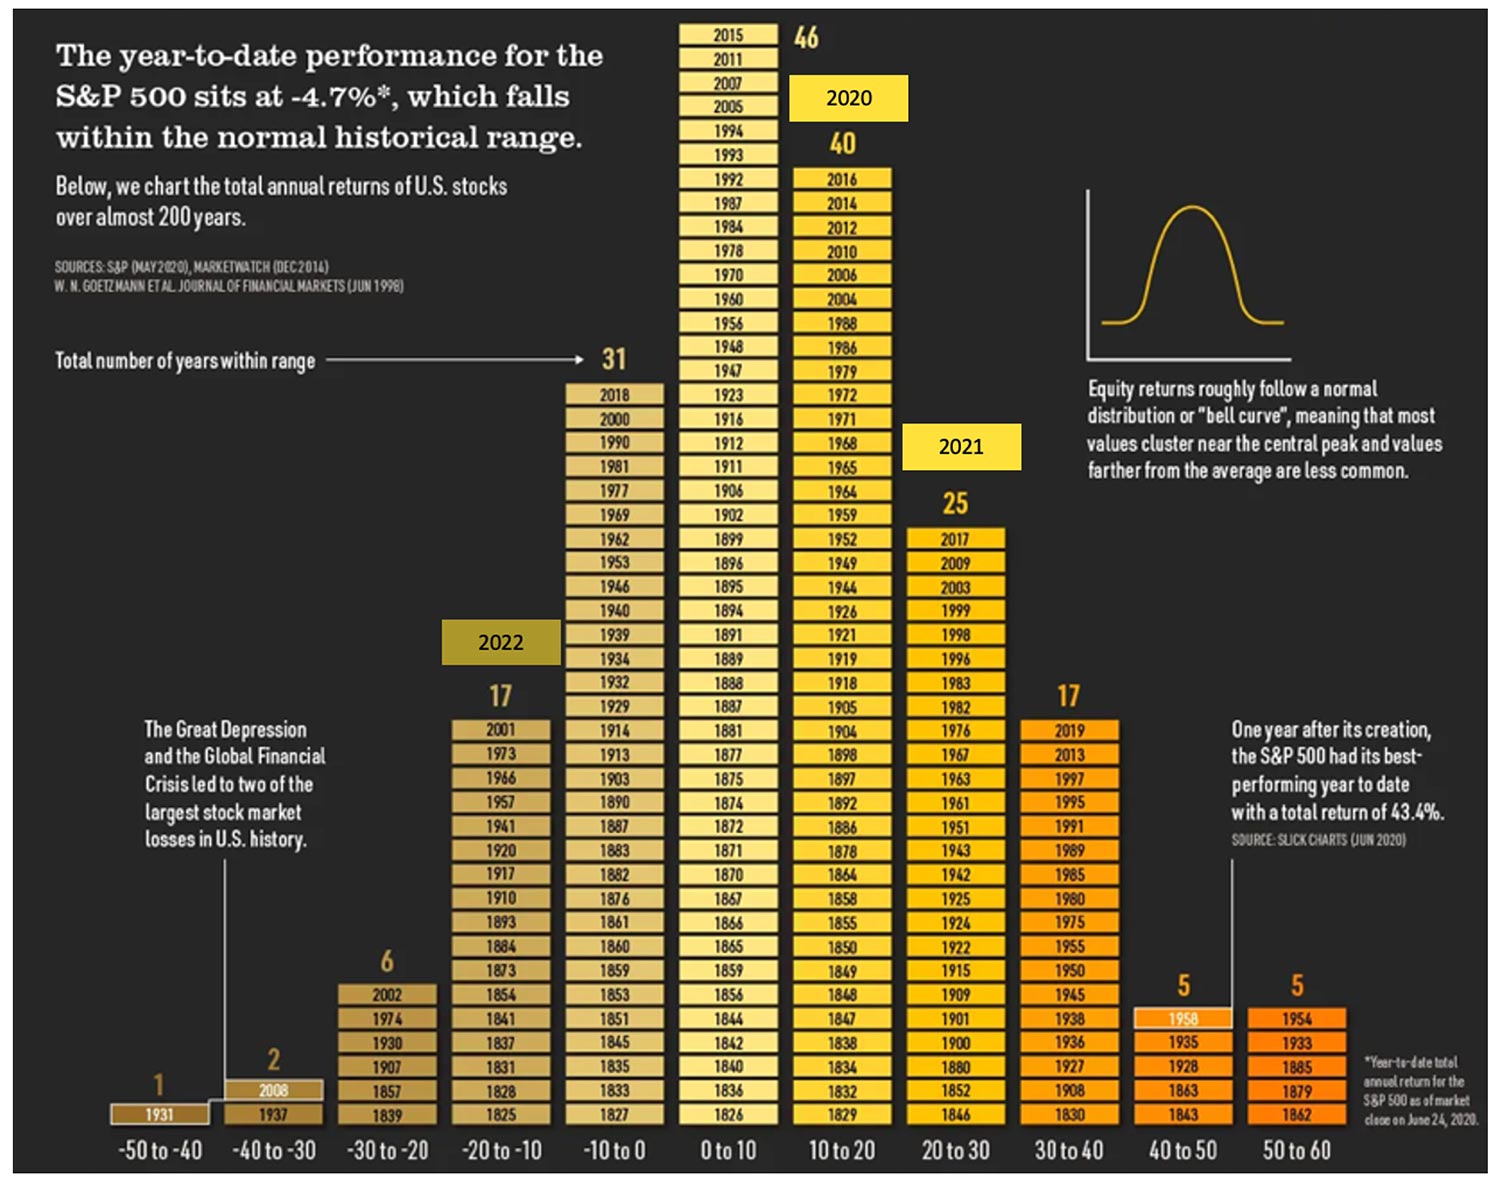
Source: Visual Capitalist, New York Life Investments.
Market Index undertook the same analysis of the Australian market from 1900. This is no mean feat considering data for Australian stock market returns haven’t been collected by any single organisation for very long. Recall it was only in 1987 that the Australian Stock Exchange was incorporated after amalgamating the six independent stock exchanges that operated in the states’ capitals. Start going further back and the data is certainly patchy.
Figure 2. Australian stock market annual return histogram, 1900 to 1919
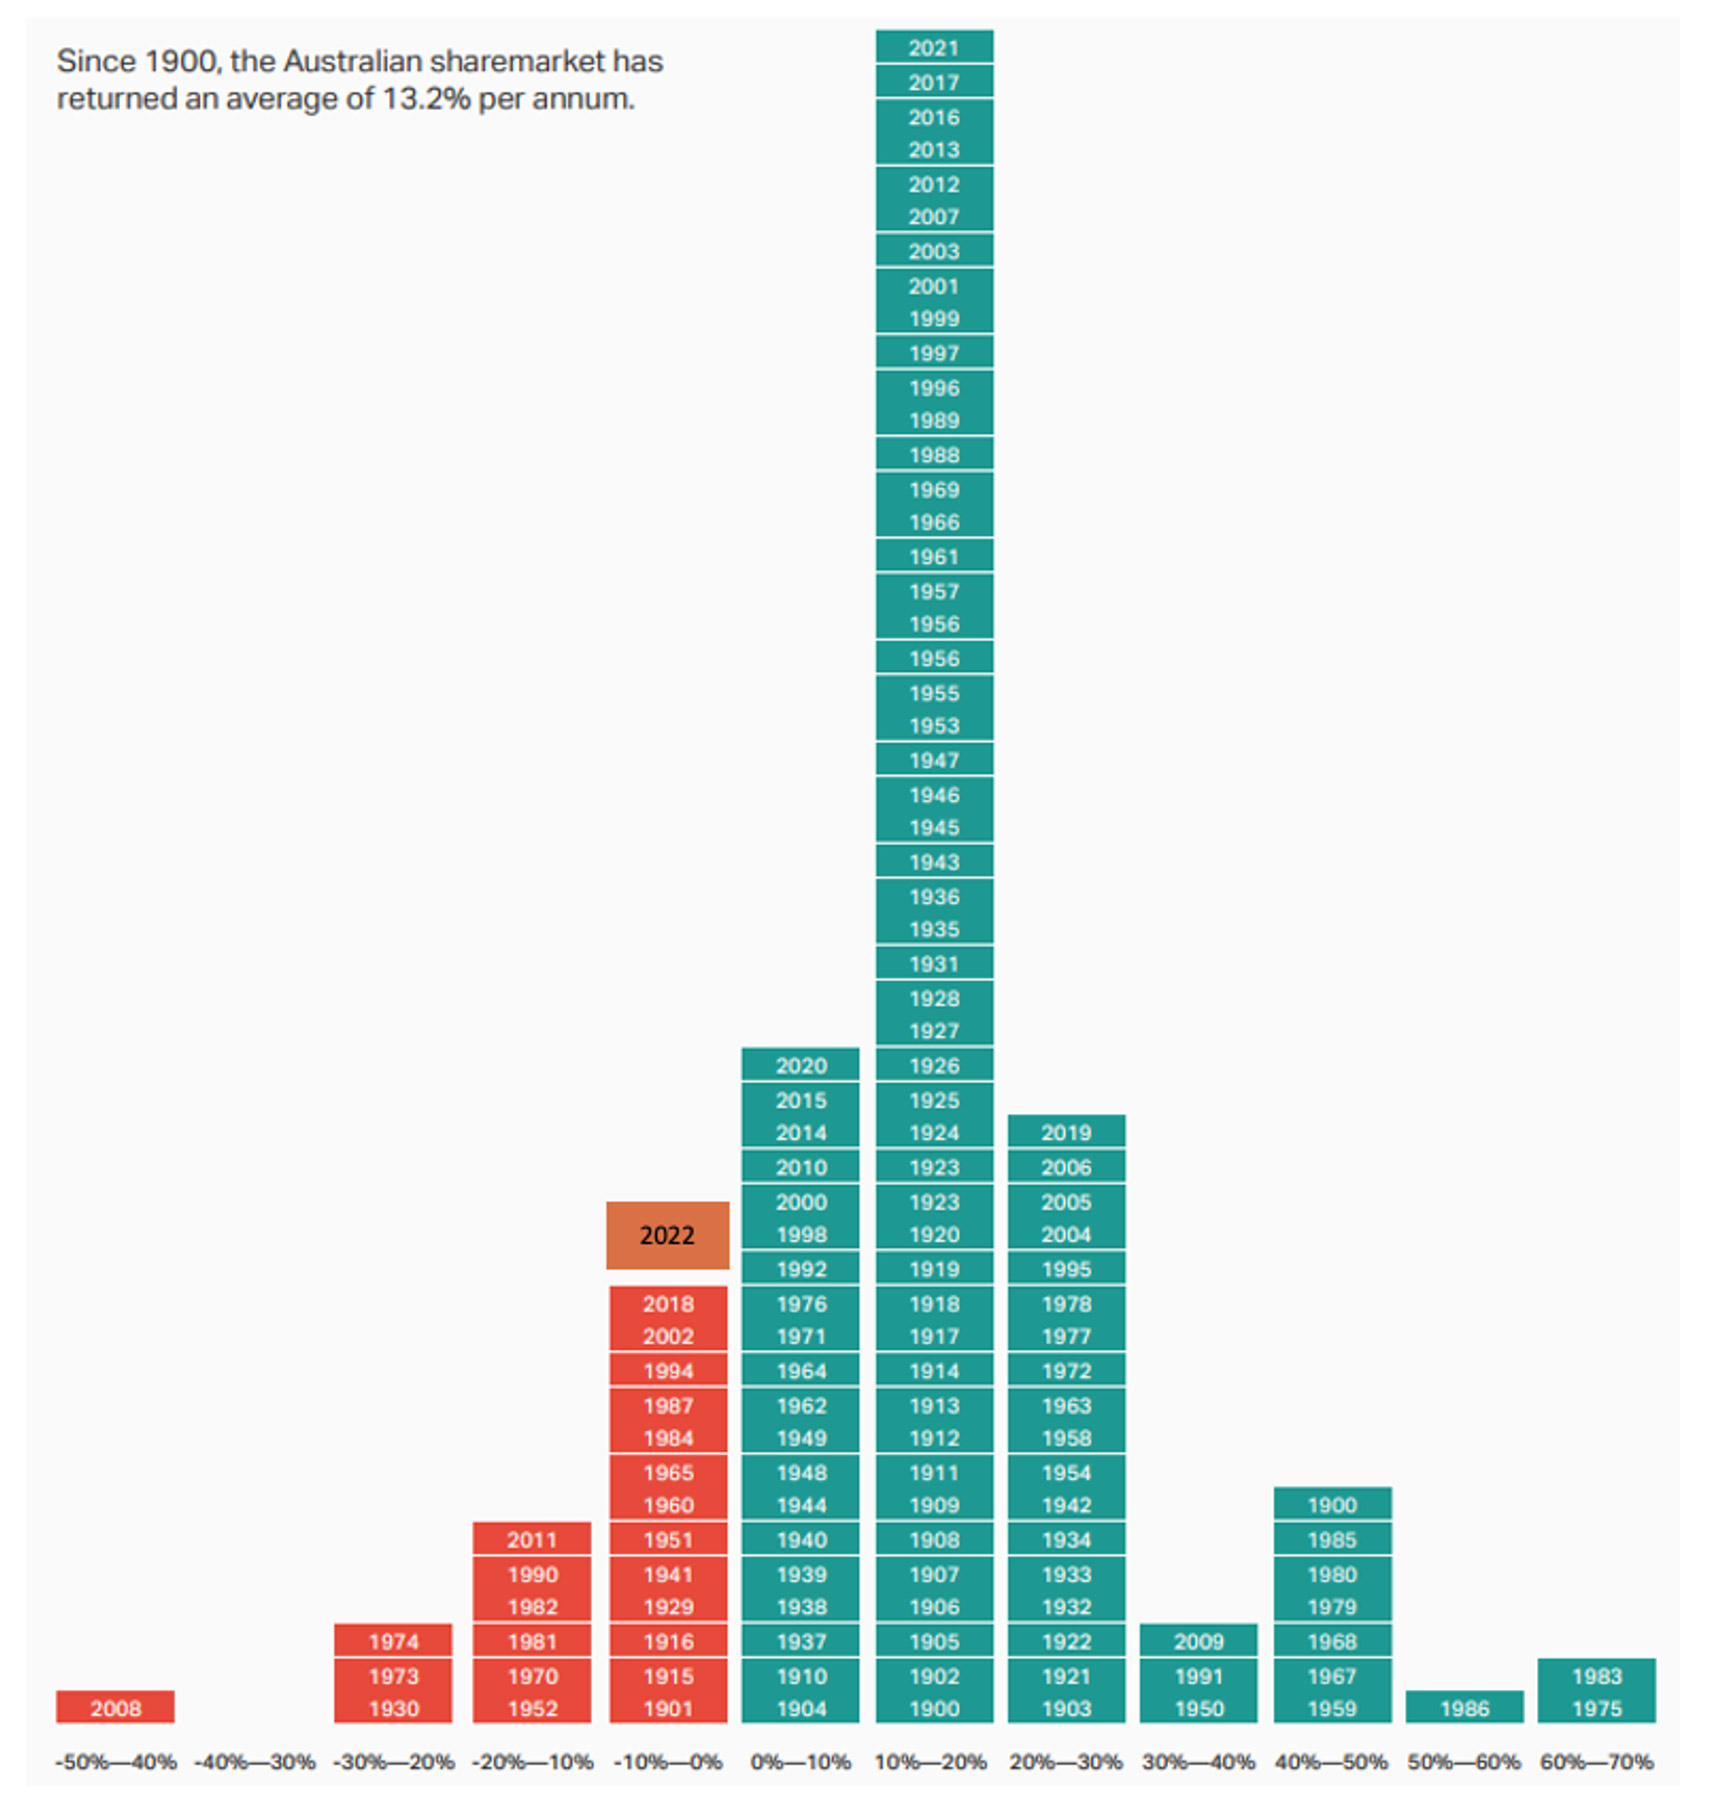
Viewing the Australian experience, we see 81 per cent positive years and 19 per cent negative years. The probability of positive years investing in Australia is even higher than the S&P500 but of course the US offers a larger data sample, so Australia may migrate closer to 50/50 in due course – hopefully not of course, for that would be terrible for the current generation of investors who would see more frequent negative years than positive years!
Historically, we also see in Australia, a similar and important pattern of great years following poor years.
The worst year of 2008, when the market fell between 40 and 50 per cent, was followed by a 30 to 40 per cent gain in 2009. A decline of 20 to 40 per cent in 1974 was followed by a 60 to 70 per cent gain in 1975. The fall of 28 per cent in 1930 was followed by a 20 per cent gain in 1931. In 1952, 1970, 1990 and 2011 the ASX index fell between 10 and 20 per cent and each year was followed by a year the market rose by 14.8 per cent, 4.3 per cent, 34.2 per cent and 18.8 per cent respectively.
In 1981 and 1982 the market fell 13 and 14 per cent respectively. In 1983 the market rose 67 per cent. In 1984 the market fell 2.3 per cent and in 1985 the market rose 44 per cent, and in 1986, 52 per cent.
Since 1900, there have been 23 years in which the market has recorded a negative year (we’ve excluded 2022 because the 2023 year remains incomplete) but there have only been five occasions (21 per cent) where a negative year was repeated the following year. Thirteen negative years were in isolation, and another five were second negative years that didn’t flow into a third negative year. In other words, 78 per cent of the time a negative year has not been followed up with another.
Also exploring Australian data going further back to 1875, Katana Asset Management discovered the average return for investing in any seven-year period was 100 per cent, and there were only two rolling seven-year periods that produced a negative return. Think of it this way, had you invested in the Aussie index at the beginning of any year since 1875, turned off your computer (note the world’s first personal computer was invented in 1971 and the Apple II was released in 1977), went away and came back seven years later, then on average you would have generated a 100.6 per cent return.
Meanwhile, investing over any eight-year period yielded an average return of 120 per cent and there weren’t any negative eight-year investment windows.
The more you look, the more encouraging the data promoting investing in equities when sentiment is negative.