
Over the past month, the Dow Jones Industrial Index has outperformed the tech-heavy Nasdaq Composite Index and a new narrative has emerged that the market is favouring ‘value’ and ‘re-opening’ stocks (contained in the Dow) over ‘growth’ and ‘COVID winner’ stocks (listed on the Nasdaq). The problem with this simple narrative is that some businesses can have the characteristics of both a ‘value’ and a ‘growth’ stock.
The chart below shows the daily change in the Dow Jones Index vs the Nasdaq. The Dow is perceived to be a better reflection of the “real” economy given its representation of the companies in its constituency, with 26 of its 30 members having representation in the S&P 500 Value index.
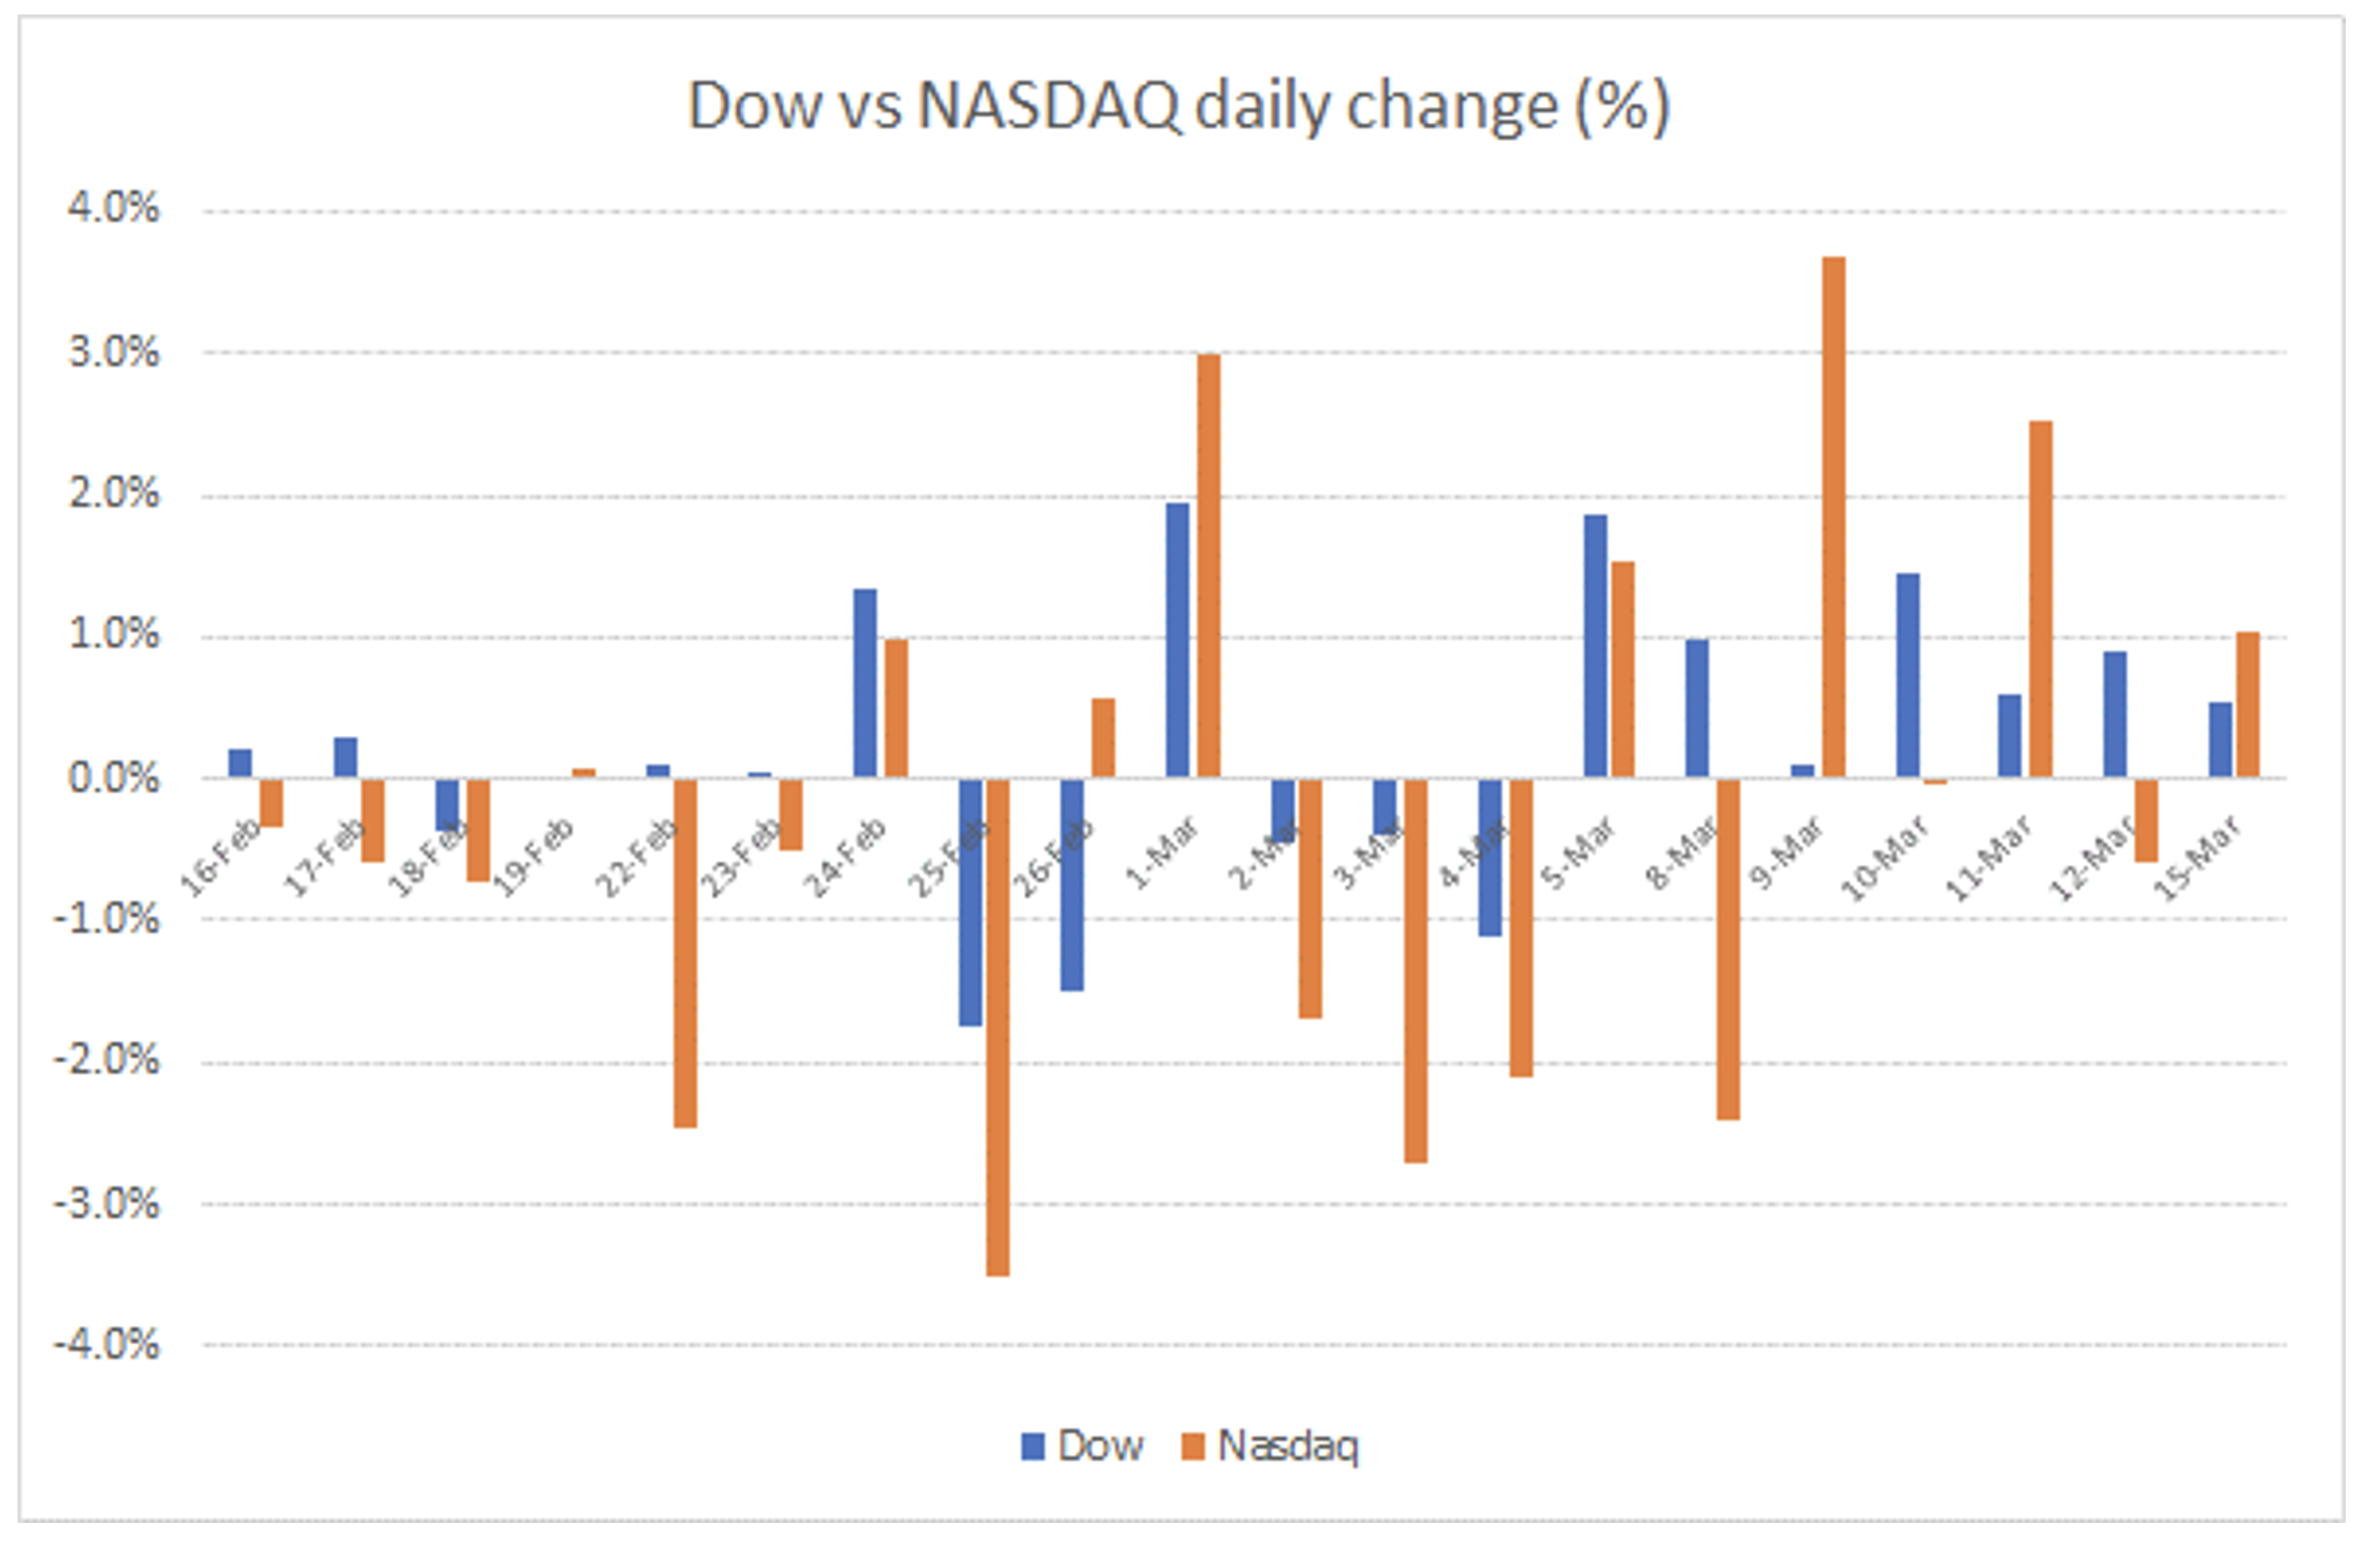
Source: MIM, Bloomberg
As per the chart above, it is quite clear there is significant divergence between the two indices on most days over the past month. For example, the performance of the two indices diverged by more than 0.5 per cent on 16 of 20 days (80 per cent), and by more than 1 per cent on 12 of 20 days (60 per cent). Over this period, the Dow has risen by 4.7 per cent while the Nasdaq is down 4.6 per cent.
By comparison, this sort of divergence was observed in just 26 per cent and 4 per cent of trading days in the decade leading up to COVID. This has helped fuel narratives while accentuating thematic flows that are leading to significant divergence of individual stock / sector performance.
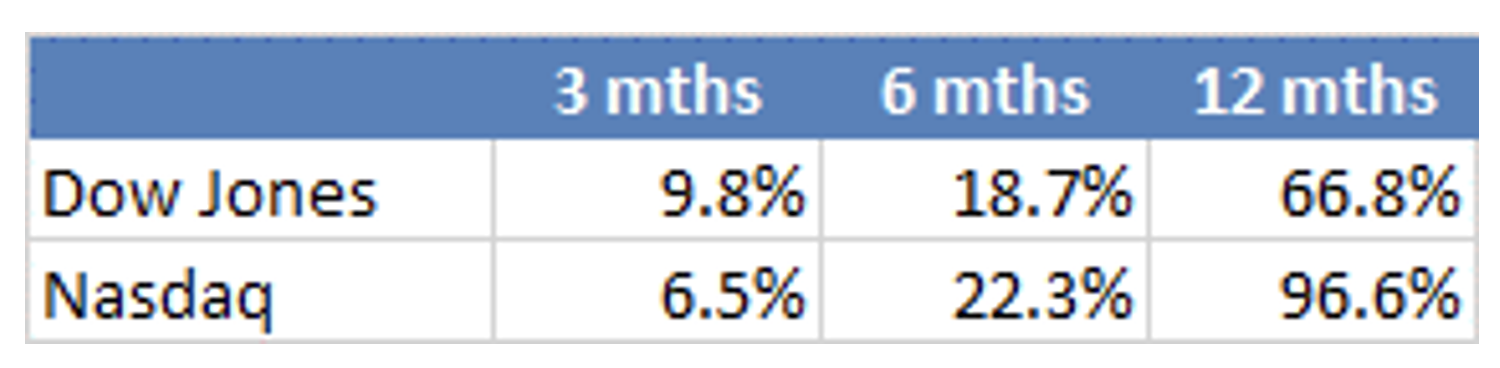
Source: MIM, Bloomberg
Over a longer period, the tech-heavy Nasdaq has still delivered significant outperformance, which may explain the “rotation” trade that is playing out in the US.
How has this played out in Australia?
It may be tempting to think that this rotation from tech/growth to value has had a similar dynamic in Australia, and more recent share price performance (i.e. past 3 weeks) certainly supports this argument. The ASX 300 is more skewed toward sectors most investors would generally consider “value” especially by market capitalisation with over 50 per cent represented by the Banks and Resources sectors, and more than 70 per cent by number likely to be considered “value” by most investors.
However, it’s worth noting that the materials sector – and miners especially – have outperformed significantly over the past 12 months especially on an equal-weight basis, with 1) the iron ore price benefitting from Chinese stimulus during 2020 and lingering production concerns in Brazil; 2) the manufacturing boom as a result of “stay at home” dynamics which has fuelled demand for goods over services (ie share of wallet); and 3) the spike in EV-related commodity exposures with clean energy and ESG thematic investing, which has supplemented early signs of growth in EV penetration.
The Australian Banks sector has also delivered solid returns, with an average return of around 62 per cent including the regionals (or 60 per cent for the big 4), outperforming the broader benchmark by approximately 30 per cent following their steep decline (with the benchmark being market-cap weighted).
Somewhat notably, the rest of the companies considered “value” have lagged in the past 3 months, delivering 2.2 per cent (on an equal-weight basis – MIM estimates) vs growth at 4.2 per cent.
Finally – it’s also worth noting that of the 26 of 30 DOW members considered “value” in the S&P 500 value index, 16 of them are also included in the “growth” index. For example, United Health Group, which is the largest constituent by weight in the DOW, has a similar representation in both the growth and value indices. What may be more surprising is a business like Caterpillar, which many would consider a more traditional value company, has only a slightly higher representation in the value index.
This clearly reflects the index construction methodology in terms of blending the market capitalisation representation equally across the two indices, but also the difficulty of categorising most businesses into two very blunt buckets. The measures S&P uses to rank the companies into growth or value are shown below:
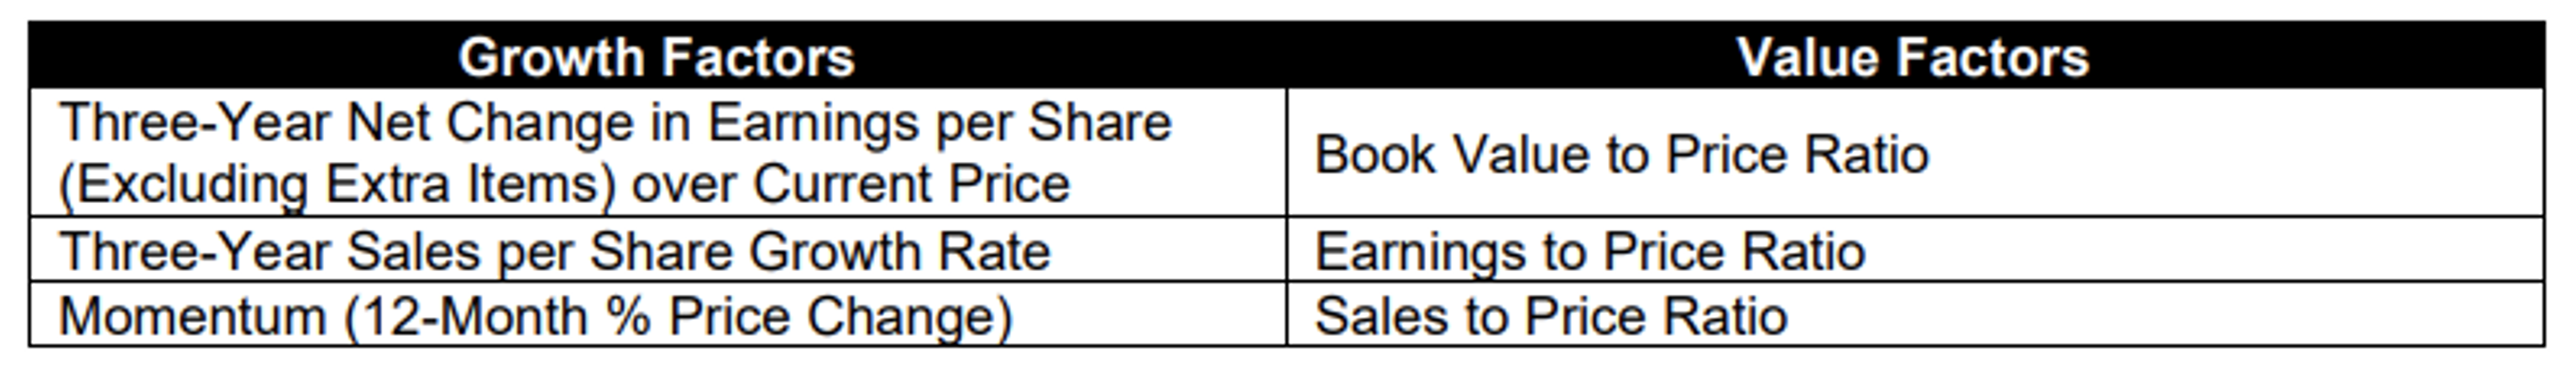
Source: Standard and Poors
It is a useful reminder that while the simple narrative makes a good headline, the devil is generally in the detail.
For those interested in the S&P index methodology, the link is below:
https://www.spglobal.com/spdji/en/documents/methodologies/methodology-sp-us-style.pdf